Research Insights, October 03, 2022
Building Value: Strategies for Reducing Urban Heat

Building Value is a series from American Realty Advisors that explores investment strategies, building improvements, and management initiatives designed to promote our environmental, social, governance, and resiliency goals.

---
The Strategy: Cool Roofs + Trees
Why Are Cooling Strategies Needed?
People around the globe are experiencing more frequent and severe heat waves. On July 20, 2022, over 100 million Americans were under active National Weather Service extreme heat advisories1. Higher temperatures lead to increased demand for air conditioning and energy use, resulting in higher costs and less grid reliability. Extreme heat also leads to adverse public health impacts including death, especially among the most vulnerable.
.jpg)
What is the Role of Commercial Real Estate in Heat Waves?
In a study published in June 2022 by the Office of Science of the U.S. Department Of Energy, researchers found that during heat waves, buildings disperse 20% more heat into the environment due to rise in air conditioning use, exacerbating the already hot temperatures. They also found that this effect is more prevalent in inland, dense urban areas as opposed to coastal or suburban areas leading to urban heat islands within cities.
Currently during heat waves, buildings support grid reliability by participating in demand response programs – essentially agreeing to power down nonessential electricity use during high heat events. However, the concept of a virtual power plant – or a smart grid – is emerging. During an August FlexAlert in California, more than 2,000 homeowners sold over 16MW of power they had stored in their home batteries back to the utility by opting in via an app. The participating homeowners were compensated $2 for every kWh they sent back to the grid. As commercial buildings begin to implement battery storage, an opportunity arises to work with the utility to mirror this system on a larger scale, supporting grid reliability during extreme weather or other power surge uses.
How Can Investors Offset Their Buildings’ Contributions to Heating Cities?
One effective strategy for cooling is the installation of cool roofs, which reflect the sun’s rays instead of absorbing heat into the structure. They are typically light in color and can take the form of shingles, tiles, membranes, coatings, or spray foams. Green roofs, which often include covering the roof in vegetation, also fall in this category. In 2005, California instituted a prescriptive cool roof requirement into its building code, and others have followed suit in Alabama, Florida, Georgia, Hawaii, Nebraska, and Texas.
Cool roofs stay up to 50–60°F (28–33°C) cooler than conventional roofs during peak summer weather2 and can reduce energy use by up to 20%, leading to lower bills3. Cool roofs also reduce demand for air conditioning while also reducing air pollution and associated health problems related to heat. Maintaining efficient HVAC systems also contributes to reducing energy needs to air condition interior spaces.
Another effective strategy for cooling urban areas is establishing tree canopy and vegetation. Evapotranspiration adds moisture to the air while shade offers lower temperatures on the ground and reduced energy demand inside. Intuitively this makes sense, but we wanted to understand how material tree canopy coverage is in relation to building operating expenses – to evaluate this, we studied different office nodes in Los Angeles to understand the correlation of tree canopy and property value for commercial buildings.
What Do Differences in Tree Canopy Tell Us About Commercial Desirability?
Office buildings are not homogenous assets. Floor plate size, views and location, on-site and nearby amenities all factor into building occupancy and in turn operating cost loads, making it somewhat difficult to isolate the impact specific characteristics have on property economics.
In order to control for some of these elements, we elected to hone in on a particular neighborhood (in this case, Downtown Los Angeles) to minimize differences when it comes to general area amenities and proximity to workforce. We further reduced the scope of our study to only encompass existing office buildings designated as Class A, 4-5 Star quality of 100,000 sf or larger (most representative of what would constitute institutional investors’ holdings).
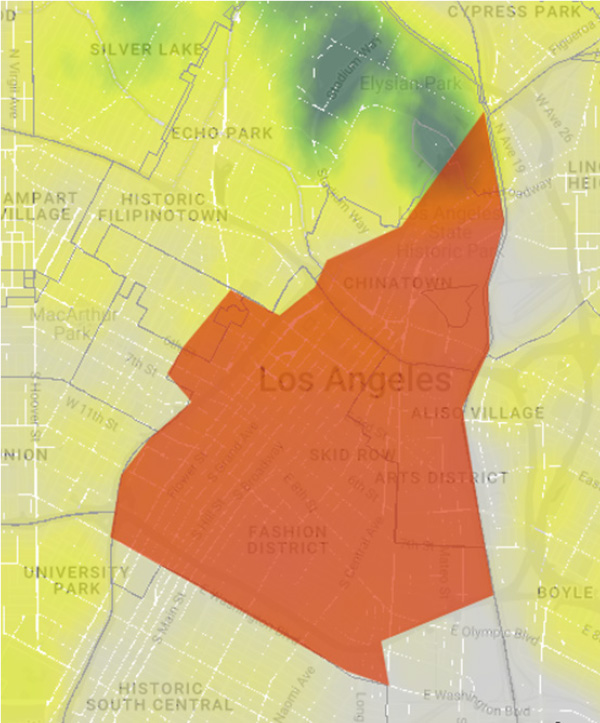
Per CoStar, the vacancy rate of this subset of buildings in the Downtown LA submarket stood at 17.6% as of Q2 2022, with an average tree canopy coverage of 4% (see image, below). These metrics served as our control baseline to determine whether higher tree canopy leads to lower opex.
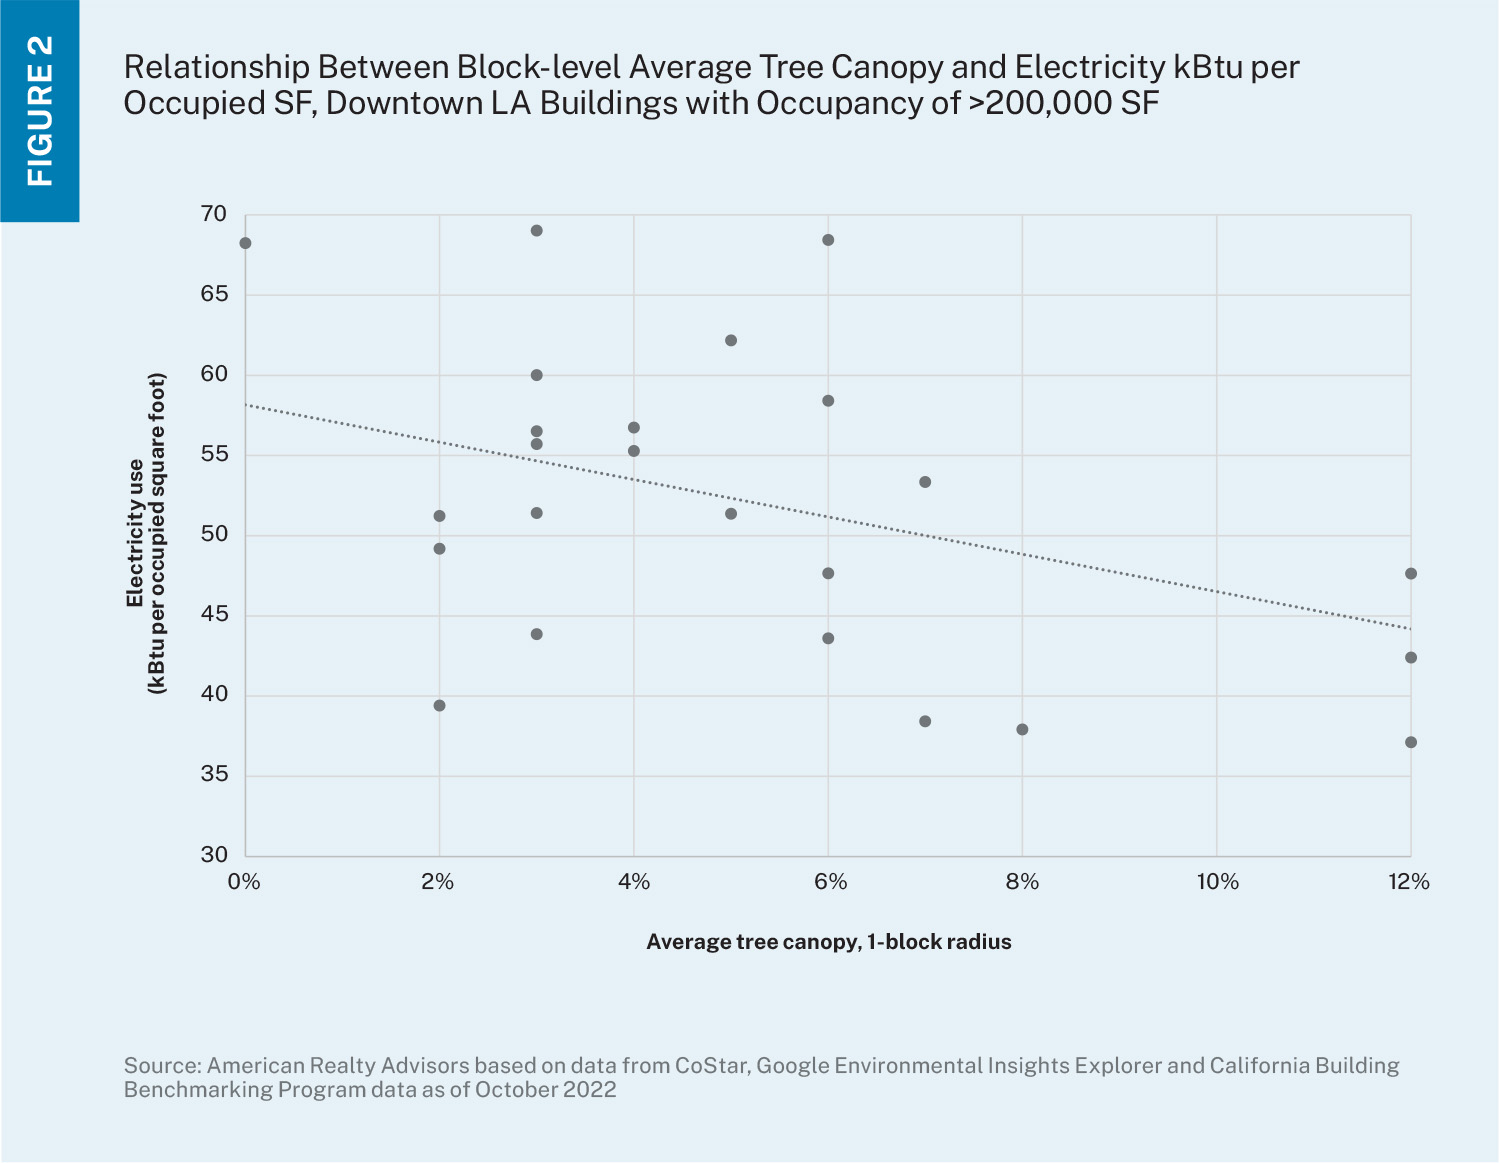
 We next focused on measuring a building’s electricity use relative to its occupancy and average canopy within the property’s block. To do this, we calculated the electricity use in kBTUs per occupied square foot (utilizing data from CoStar and the California Building Benchmarking Program) and then plotted this metric against the average canopy coverage percentage from Google’s Environmental Insights Explorer for the one-block area around each building.
Absent a few outliers (for which there may be other explanations, such as a building whose occupancy is artificially low due to a strategic repositioning or a building whose usage is higher because there is also a post office or restaurant on site that utilizes more electricity), there does appear to be a link between higher immediate tree canopy and lessened electricity utilization, a pattern that is particularly evident in buildings with occupancy of more than 200,000 sf (Figure 2), a benefit that ultimately lowers operating costs for owners, in turn strengthening net operating income and cash flows.
How Can Cooling Strategies Build Value for Investors?
A California study found that cool roofs provide an average yearly net savings of almost 50 cents per square foot. If all commercial buildings in the U.S. switched to cool roofs, $1 billion in savings per year would result from avoided energy use.
The cost premium for cool roofing materials can range from 0 – 20 cents per square foot on average. To offset this cost, many local utilities offer rebates, which compound savings over time due to reduced first cost for materials plus continuous reduction of indoor energy use from the cool roof.
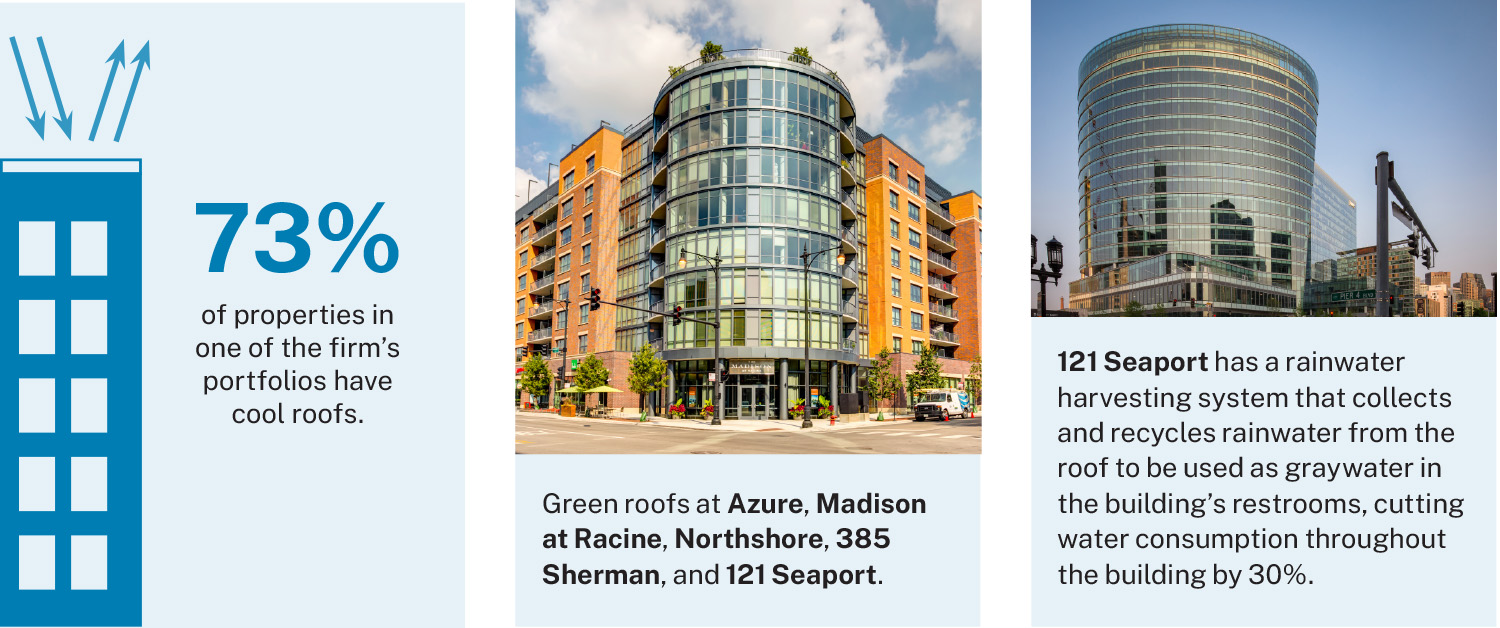
ARA Cooling Initiatives
Discover More

---
Notes
1 Source: www.heat.gov
2 Source: EPA, www.epa.gov/heatislands/using-cool-roofs-reduce-heat-islands
3 Source: Global Cool Cities Alliance, www.globalcoolcities.org/discover/unlock/unlock-energy-savings/
Disclaimer
The information in this newsletter is as of October 3, 2022, and is for your informational and educational purposes only, is not intended to be relied on to make any investment decisions, and is neither an offer to sell nor a solicitation of an offer to buy any securities or financial instruments in any jurisdiction. This newsletter expresses the views of the author as of the date indicated and such views are subject to change without notice. The information in this newsletter has been obtained or derived from sources believed by ARA to be reliable but ARA does not represent that this information is accurate or complete and has not independently verified the accuracy or completeness of such information or assumptions on which such information is based. Models used in any analysis may be proprietary, making the results difficult for any third party to reproduce. Past performance of any kind referenced in the information above in connection with any particular strategy should not be taken as an indicator of future results of such strategies. It is important to understand that investments of the type referenced in the information above pose the potential for loss of capital over any time period. This newsletter is proprietary to ARA and may not be copied, reproduced, republished, or posted in whole or in part, in any form and may not be circulated or redelivered to any person without the prior written consent of ARA.
Forward-Looking Statements
This newsletter contains forward-looking statements within the meaning of federal securities laws. Forward-looking statements are statements that do not represent historical facts and are based on our beliefs, assumptions made by us, and information currently available to us. Forward-looking statements in this newsletter are based on our current expectations as of the date of this newsletter, which could change or not materialize as expected. Actual results may differ materially due to a variety of uncertainties and risk factors. Except as required by law, ARA assumes no obligation to update any such forward-looking statements.