After months of an economy that has been prone to contradiction, July’s labor market data seemed to contribute to more of the same mixed signals. However, in our view, the fog is starting to lift, and two metrics in particular are helping clear the air: 1) fewer jobs are now needed to keep the labor market healthy, and 2) economic gains are starting to broaden to include a wider range of households. All told, we see a more positive backdrop forming heading into the second half of the year.
Labor Market
In July, the U.S. economy lost 23,000 jobs, even as the unemployment rate ticked down to 4.1%.1 While the signals seem mixed, the deeper you dig, the more the data points to an economy adjusting to a shrinking workforce.
By historical standards, the unemployment rate is remarkably low – the kind of number that would typically signal a labor market firing on all cylinders. But the reality has felt different all year. The labor market has been stuck in a “low-hire, low-fire” holding pattern, punctuated by steady headlines about layoffs, and that undercurrent has been hard to ignore. July’s jobs report reignited those concerns as payrolls came in well below expectations, and downward revisions to prior months only reinforced that something is off. And yet, somehow, the unemployment rate has fallen even further. So, what is actually happening?
The answer isn’t that the unemployment rate fell because jobseekers found jobs. It fell because people stopped looking for them. The Labor Department’s household survey showed the number of employed Americans fell by 87,000 in July, but the labor force itself shrank by a much larger 264,000. When people exit the labor force entirely, whether by choice or discouragement, they are no longer counted as unemployed. The math mechanically pulls the rate down, even as fewer people are actually working.
On its face, this sounds scary, as if the economy is so weak that people are simply choosing to drop out of the workforce entirely. But like everything in this current environment, it pays to look deeper. One element at play is the aging of the workforce. The youngest baby boomers turn 62 this year, old enough to start claiming Social Security, just as the supply of younger workers ready to take their place continues to shrink. At the same time, the current administration’s immigration policies have curbed the flow of foreign-born workers, one of the few reliable sources of labor-force growth in years past.
Taken together, there is a real argument that this isn’t so much a weakness as it is a resizing. Economists at the American Enterprise Institute and Brookings have estimated that the economy now needs to add only around 15,000 jobs a month to hold the unemployment rate steady, a fraction of what would have counted as healthy job growth just a few years ago.2 Under that framework, the past seven months look less alarming; even with July’s outright loss factored in, the economy has still added an average of roughly 61,000 jobs a month.3 This may not be evidence of a stalling economy; instead it could mean that the economy is simply adjusting to a shrinking supply of available workers (Figure 1).
Figure 1 – YTD Payroll Gains vs. Current Breakeven Estimation
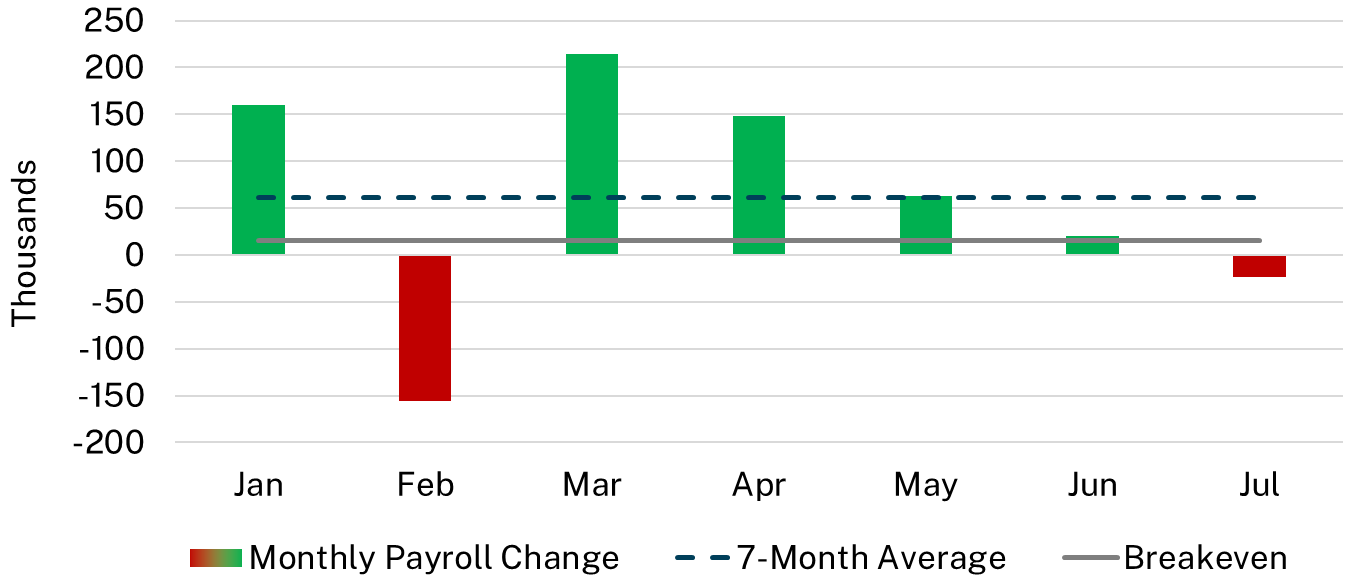
Source: American Realty Advisors based on data from U.S. Bureau of Labor Statistics, “All Employees, Total Nonfarm” [PAYEMS], retrieved from FRED, Federal Reserve Bank of St. Louis (fred.stlouisfed.org/series/PAYEMS); monthly changes calculated from seasonally adjusted levels. Breakeven range per American Enterprise Institute–Brookings Institution, “Macroeconomic Implications of Immigration Flows in 2025 and 2026: January 2026 Update.
Consumer Spending
When we look at consumer spending, there’s reason for optimism. Real consumer spending grew 2.3% over the past year, close to its 2015-2019 pre-pandemic average of 2.7%.4 After years of pandemic-driven whiplash – spending cratered in 2020, then swung wildly through the recovery – this annual rate is about as close to “normal” as the data has looked in a while.
While this is reassuring, the brighter signal is in who is doing the spending. For years, lower-income households have been squeezed by inflation outpacing their paychecks, while wealthier Americans saw gains in home values and stock portfolios. However, new weekly earnings data shows that lower-income workers got a real raise this spring, with paychecks for the lowest earners rising 5.5% from a year earlier and 4.6% for those in the middle, both comfortably ahead of inflation and both outpacing gains for higher earners.5 While the pay bump may not feel meaningful to all households yet, it is translating to more spending. Bank of America data shows lower-income households picked up their spending noticeably in June compared to a year earlier, not just on essential items like groceries and gas, but on discretionary items too. For a group of households that have been playing catch-up for years, this is the clearest sign yet that things may be starting to even out.
Implications for Commercial Real Estate
A stronger consumer doesn’t just show up in GDP numbers, it also flows through to nearly every corner of commercial real estate. Retail, industrial, and multifamily all depend, in different ways, on people having money and being willing to spend it.
Retail typically feels it first and most directly. When consumer wallets have more cushion, that money tends to move more quickly as it covers everyday costs and funds a jump in discretionary purchases. This shows up almost immediately as an increase in foot traffic and sales volume. Healthier retailers mean stronger demand for retail space, fewer vacancies, and firmer rents.
That same spending also moves through e-commerce, not just storefronts. Every online order passes through a warehouse, a fulfillment center, or a last-mile delivery hub before it reaches someone’s door. That spending, in turn, generates incremental demand for the industrial space that keeps supply chains running.
Then there’s the renter, whose ability to lease space depends on the same paycheck driving the rest of the economy. And with wage growth broadening across income levels, that translates into fewer missed payments, less turnover, and steadier occupancy, the building blocks of healthy rental demand.
The picture is straightforward: a healthy consumer doesn’t just keep the broader economy afloat, it runs straight through the foundations of commercial real estate. Every part of that foundation, in the end, depends on the same thing: how households are doing financially. If that keeps improving, the case for commercial real estate gets stronger right along with it.
Notes
1 Source: U.S. Bureau of Labor Statistics, July 2026 Employment Situation Report.
2 Breakeven job growth scales with net immigration: AEI-Brookings estimate ~15,000/month under net outflow (~-77,000/month) versus ~87,000/month under net inflow (~+48,000/month).
3 Source: U.S. Bureau of Labor Statistics, Employment Situation Reports.
4 Source: U.S. Bureau of Economic Analysis, Gross Domestic Product Release, Q2 2026.
5 U.S. Bureau of Labor Statistics, Current Population Survey, Weekly Earnings by Percentile, Q2 2026.
Disclaimer
The information in this newsletter is as of August 13, 2026, and is for your informational and educational purposes only, is not intended to be relied on to make any investment decisions, and is neither an offer to sell nor a solicitation of an offer to buy any securities or financial instruments in any jurisdiction. This newsletter contains a mix of (i) statements of fact and (ii) opinions, beliefs, estimates, expectations, and other forward-looking statements. Statements of fact are based on information we believe to be reliable, but we do not represent that all such information is complete or accurate in all respects. Opinions, beliefs, estimates, and forward-looking statements are inherently uncertain, are based on judgment and assumptions as of the date indicated and may change without notice. They are not guarantees of future results. Except as required by law, American Realty Advisors assumes no obligation to update any such forward-looking statements. This newsletter is proprietary to ARA and may not be copied, reproduced, republished, or posted in whole or in part, in any form and may not be circulated or redelivered to any person without the prior written consent of ARA.





Build-to-Rent Gets a Green Light in New Housing Legislation