The recently enacted housing legislation made headlines for its proposed restrictions on institutional capital competing with would-be buyers for single family houses. Ultimately, the 21st Century ROAD to Housing Act placed no restrictions on purpose-built or build-for-rent single-family rentals (BTR/SFR), which we believe will help cement the sector’s place in residential portfolios for years to come. In this article, we take a look at the legislation and other demand drivers for build-to-rent that are creating a backdrop for favorable investment.
What is in the ROAD to Housing Act?
The bill’s full text combines more than 40 measures aimed at encouraging home construction, expanding access to home financing, and qualifying the types of SFR projects that can be acquired and by whom. In our view, the largest provisions based on anticipated market impact cluster around three central tenets:
1. Institutional investor restrictions and BTR carve-out
Title 10, Section 1001 prohibits any large institutional investor (defined as for-profit groups that have investment control of 350 single-family homes or more) from purchasing further single-family homes, with the explicit carve-out for BTR. New single-family homes built in communities intended for the purpose of renting are excluded, and existing BTR communities are grandfathered in.
The practical implication: Owners who participated in scattered-site SFR strategies (for example, buying individual homes across a metro) that own more than 350 units are effectively left without a path forward. Groups who have focused exclusively on purpose-built communities of single-family homes can continue to pursue development and may also transact on existing assets that are grandfathered.
2. Permitting and environmental review streamlining
Several parts of the legislation are designed to make it easier and faster to build new housing. The bill does this by reducing some environmental review requirements, giving state and local governments a larger role in handling those reviews, and providing annual grant funding to communities that can show they are increasing the supply of housing.
The practical implication: Faster entitlements, less red tape, and economic incentives should make it easier and less expensive to get approval to build housing.
3. Manufactured housing reform
The Act removes the requirement that manufactured homes be built on a permanent steel chassis and also seeks to make financing more widely available.
The practical implication: Most manufactured homes are set on a lot once and not moved again; removing the requirement to maintain the heavy chassis should reduce costs, making this a more viable source of needed housing supply.
How Does the BTR Space Look Post-Act?
Originally, a draft version of the legislation proposed a seven-year forced sale requirement for excepted purchases – meaning although BTR was originally going to be excluded from the large institutional investors’ acquisition plan, they would still be subject to a disposal requirement. Had this version passed, it would have made new BTR development economically unviable, eliminating a necessary part of the housing ecosystem.
Building a new community of homes and renting them out (a la the BTR model) adds net new units to stock and supports improving housing access and affordability around the country; buying a home that could have otherwise gone to a family is not. This was the argument many made – namely, that anything that disincentivizes new supply of any kind was essentially against the goal of the Act itself. In the final legislation, BTR became a clean exemption, with no forced disposition clock. The benefit is twofold: it keeps another investment pathway into residential housing available to investors (which in turn prompts further investment into housing by managers who are investing capital on their behalf) but also removes institutional capital from competing with prospective owner-occupants for existing scattered housing stock.
As a result, the BTR space looks poised for continued growth. Institutional capital that previously might have pursued scattered-site homes (which in the last several years has represented roughly half of the number of annual investments into the space, see Figure 1) may have no choice but to pivot towards BTR or risk abandoning the rental strategy altogether; greater capital flows should make existing properties inherently more valuable and may open up additional development opportunities as well.
Figure 1 – Share of Major Institutional Investments in the SFR/BTR Sector by Deal Count, 2020 – YTD 2026
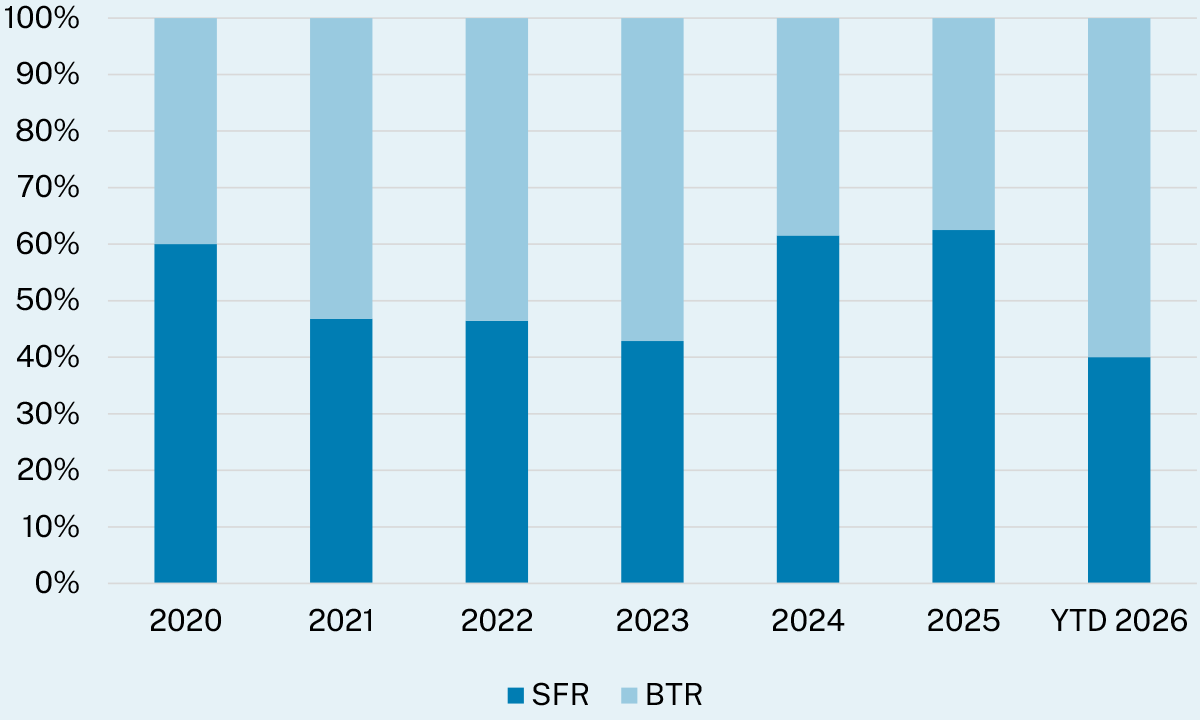
Source: American Realty Advisors based on data from John Burns Real Estate Consulting utilizing publicly announced transactions. YTD = year-to-date volumes through May 2026.
BTR’s Structural Demand Drivers
Part of our belief that capital will reallocate toward BTR is driven by the sector’s demand, which continues to be driven primarily by a Millennial demographic reaching peak family-creation years in search of space that the current lack of entry-level, affordably priced for-sale housing has failed to satisfy.
Lack of entry-level homes being sold
There are fewer homes sold that are accessibly priced for the first-time homebuyer than there has been throughout much of the last two decades. Adjusting for inflation (so that “$300,000” reflects the same purchasing power in every year measured), the share of privately-owned homes selling under that real threshold has fallen from 30-40% for much of the 2002-2012 period to a low of just 11% by mid-2022 (Figure 2). The share has climbed off that low over the past two years, though there is another headwind: a real, inflation-adjusted $300,000 home today would have cost only $162,800 in 2002 – a difference of roughly $137,000 before even accounting for the quality of home that money is actually buying (and where).
Figure 2 – Share of New Privately-Owned Homes Sold Below Real (Inflation-Adjusted) $300,000 Equivalent Threshold
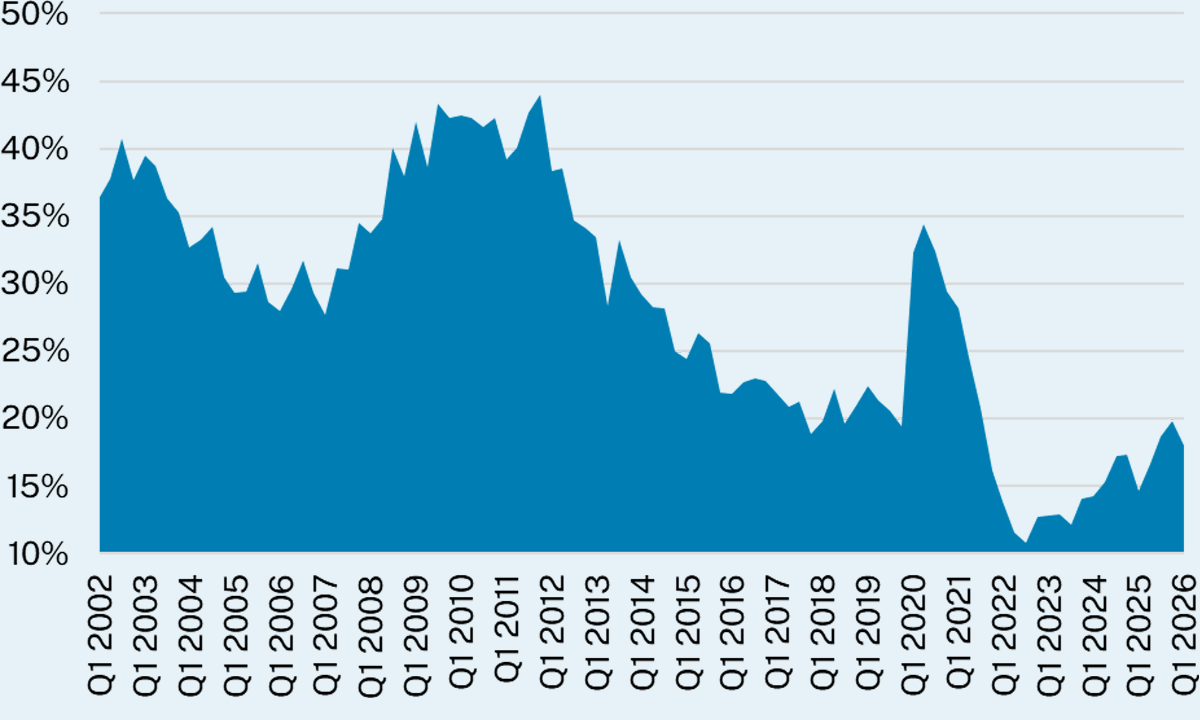
Source: American Realty Advisors based on data from the U.S. Census Bureau as of July 2026.
Significant premium to own vs. rent
There has long persisted a gap between owning a home and renting one; however, prior to the run-up in home values following the pandemic, it was a relatively static difference (roughly $400 for the better part of 2018 through mid-2021) that some would-be buyers could get comfortable with given additional tax benefits and potential appreciation upside. Today, however, the gap is nearly $1,400 per month, a material-enough margin that is not so easily justified by end-of-year tax savings, a reality that further reinforces BTR’s attractiveness for renters (Figure 3).
Figure 3 – Starter Home Monthly Payment vs. Build-to-Rent Payment, January 2018 – May 2026
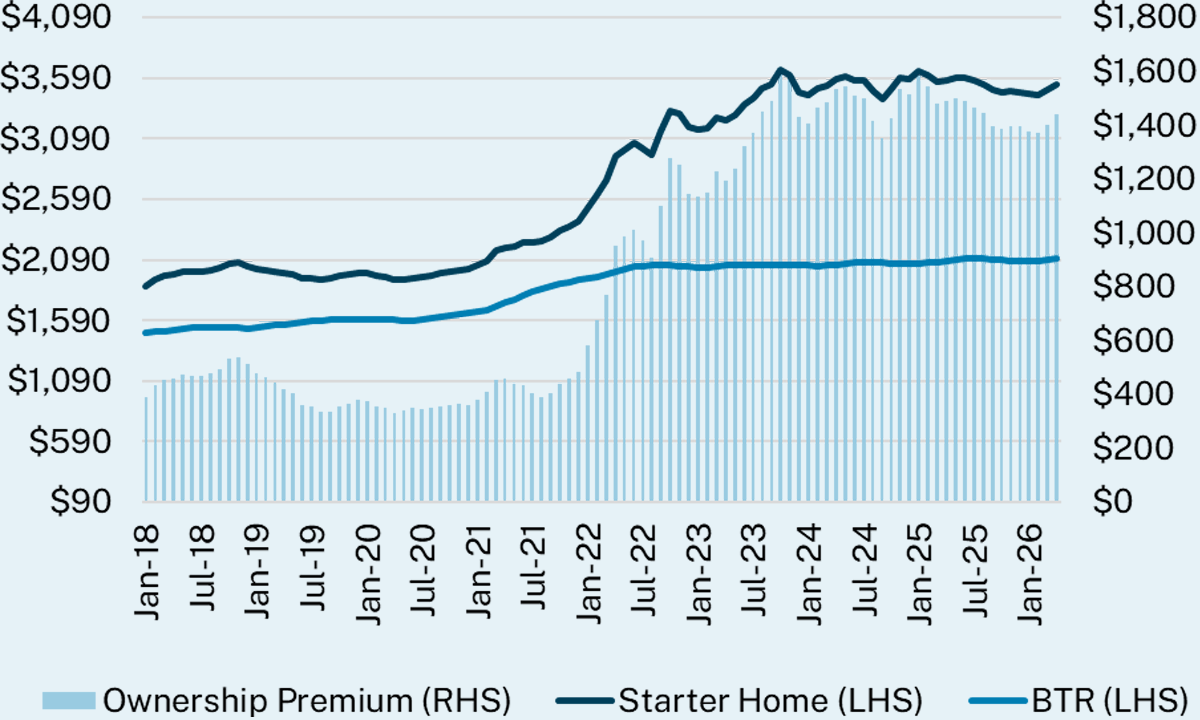
Source: American Realty Advisors based on data from John Burns Real Estate Consulting as of July 2026. Starter home payment assumes a 5% down payment, a 30-year fixed-rate mortgage, and reflects the principal, interest, taxes, and insurance plus PMI.
Lifestyle demands and configuration limits
While the rate of childbearing among Millennials is lower and later than prior generational cohorts, it is still happening at enough frequency to influence the types of housing they need. At its simplest, this means an appetite for larger floor plans that can accommodate growing families and work-from-home/hybrid setups at accessible price points. Single-family rentals offer a deeper pool of larger floor plans (Figure 4), and at a price per-square-foot that is 37% cheaper nationwide than comparable-quality 4- and 5-Star apartments.1
Figure 4 – Share of Housing Stock by Bedroom Count, Single-Family Rentals vs. Apartments
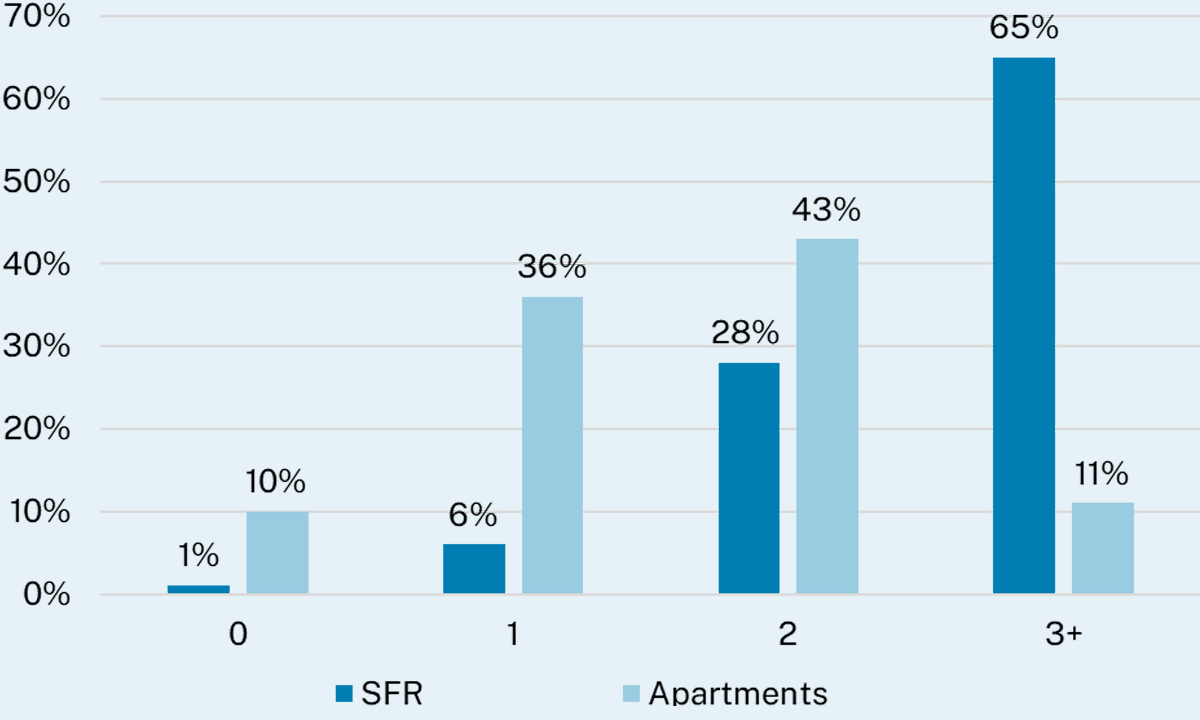
Source: American Realty Advisors based on data from John Burns Real Estate Consulting tabulations of data from the U.S. Census Bureau and the 2024 American Community Survey 1-Year Estimates (latest data available).
Conclusion
The passing of the housing bill has provided much-needed clarity for real estate owners and investors. With identifiable demand drivers still very much intact, we envision capital that was previously pursuing scattered-site models will pivot towards BTR, further reinforcing existing asset values and benefitting portfolios that have already built exposure to this segment of the rental housing spectrum.
Notes
1 Source: American Realty Advisors based on data from Yardi Matrix and CoStar as of Q2 2026. Metric reflects discretionary and upper-tier effective rents in SFR BTR product nationwide in Yardi Matrix’s database compared to 4- and 5-Star traditional apartment rents nationwide from CoStar.
Disclaimer
The information in this newsletter is as of July 24, 2026, and is for your informational and educational purposes only, is not intended to be relied on to make any investment decisions, and is neither an offer to sell nor a solicitation of an offer to buy any securities or financial instruments in any jurisdiction. This newsletter contains a mix of (i) statements of fact and (ii) opinions, beliefs, estimates, expectations, and other forward-looking statements. Statements of fact are based on information we believe to be reliable, but we do not represent that all such information is complete or accurate in all respects. Opinions, beliefs, estimates, and forward-looking statements are inherently uncertain, are based on judgment and assumptions as of the date indicated and may change without notice. They are not guarantees of future results. Except as required by law, American Realty Advisors assumes no obligation to update any such forward-looking statements. This newsletter is proprietary to ARA and may not be copied, reproduced, republished, or posted in whole or in part, in any form and may not be circulated or redelivered to any person without the prior written consent of ARA.





Resets and Recoveries: What Can Past Cycles Tell Us About Real Estate Today?