
ARA’s proprietary internal market forecasts are an integral part of our Research function that serve as a backbone of our investment process. While many rely on third-party market forecasts, we believe our process differentiates us from other investors, gives us an edge on market selection, and help us avoid chasing market momentum.
Here’s how we approach it.
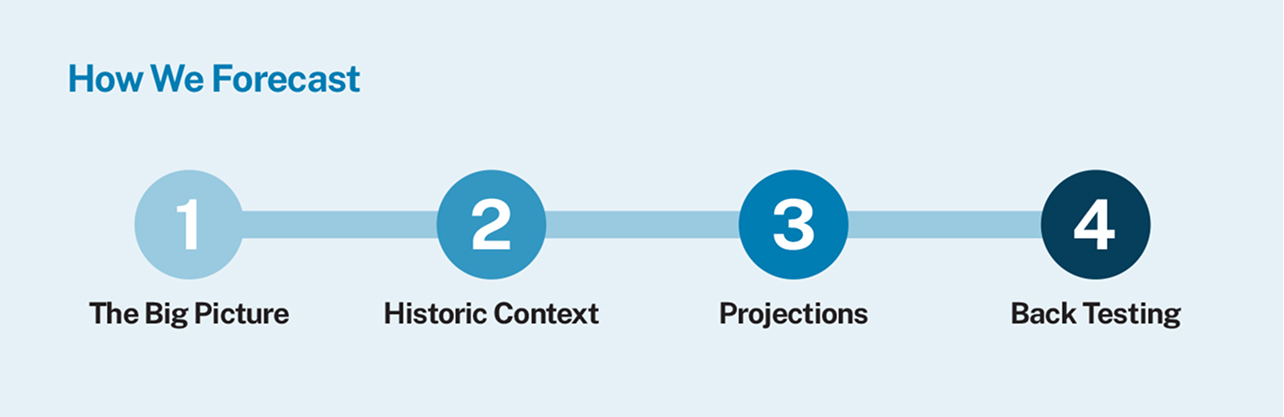
1. The Big Picture
The backbone of any internal forecast we create is our House View for the broader economy. We start with questions like: What is happening in the economy? Where are we in the cycle? What is shifting in capital markets?
The answers to these questions influence both sides of the commercial real estate equation, supply and demand. Inflation and interest rates shape affordability, financing and construction costs, and rent pressure. Population and job growth help gauge underlying demand, how much space might be needed, and how quickly markets can absorb it.
These forces might not appear as line items in the model, but they shape every assumption that do. They help us think through what tenants will be able to afford, how capital costs might change development timing, and whether a market that looks strong on paper is overheated. They also remind us that sectors respond differently depending on the phase of the cycle. The big picture doesn’t give us exact numbers, but rather the shape of expected performance going forward.
2. Historic Context
Once we’ve framed the big picture, we turn to the data to begin forecasting supply, demand, and rent growth for the largest U.S. markets across multifamily, industrial, and office. We start by grounding each forecast in history. Understanding how each market has performed over time helps shape our expectations, not by dictating them, but by giving us useful guardrails.
Long-term averages and historical ranges help us understand what’s typical and where performance has topped or bottomed out. If, for example, a market has never seen more than 6% rent growth, we’re unlikely to project 10% absent a strong and specific reason (the announcement of a major employer opening a new headquarters and hiring 10,000 new employees).
In addition to evaluating markets on their own terms, we use a separate model to see how they’ve historically ranked relative to each other. If a market that typically sits in the third quartile suddenly jumps to the top, we pause and reassess.
We also factor in recent momentum, how each market has performed over the past one, two, or three years. Strong recent growth might support a more optimistic outlook; softening performance might call for caution. Momentum keeps us from leaning too heavily on long-term averages when short-term signals are shifting.
Historical context doesn’t give us the answer, but it sharpens the questions we ask and keeps our forecasts grounded in how markets behave.
3. Projections
With history in view, we begin to look to the future. We start with supply, then move to demand, and finish with rent growth. This sequence matters: we need to understand how much product is coming online, how quickly it will be absorbed, and how those dynamics shape the ability for owners to grow rents.
Supply pipelines are the starting point of our forecasting. We aggregate data on properties in various phases of groundbreaking and construction across multiple sources, confirm project status and realistic completion year. For the outer years, we pull real-time measures of permitting activity to assign a probability of unit deliveries based on local knowledge of development timelines. Not everything permitted will get built, and not everything planned will be delivered on time.
Demand comes next. We begin with recent momentum and then test that against historical absorption. If our assumptions push the market outside its usual range, we ask why: has the market changed structurally, or are we just in a short-term upswing?
Finally, we project rent growth. This comes in as the last step because it’s shaped by the supply and demand outlook and corresponding effect on vacancy (lower vacancy, higher potential for rent growth, with the opposite also generally holding true).
4. Back Testing
Forecasting is only as useful as its accuracy. Each year, we revisit prior forecasts, and test them against what happened in the market.
We assess how each forecast performs across its full-time horizon, as well as on a year-by-year basis. For example, a forecast made in early 2020 is evaluated multiple times as new market data emerges each year from 2020 through 2024.
When a forecast misses, we take the time to understand why. Were we too aggressive in certain markets? Too cautious in others? Are there patterns in our assumptions that need to be addressed? These reflections help us fine-tune our process across the entire methodology.
The point isn’t just to score ourselves, it’s to get better. Back testing directly shapes our next round of assumptions, so much so that our margin of error has steadily narrowed over the years; for example, in our latest forecasting cycle our industrial market projections landed within roughly 1% of actual rent growth. Overall, it helps us stay consistent, improve over time, and build more durable conviction in the views we take.
There’s no single formula for forecasting. Markets can be messy, data is imperfect, and conditions change. What matters is having a process you trust, one that’s structured, consistent, and flexible enough to evolve. A forecast may not eliminate uncertainty, but it can provide a disciplined way to navigate it.


Mid-Quarter Economic Pulse: Q1 2026