Research Insights, August 09, 2021
Routine Check-Up: What Vital Signs Tell Us About Market Health
With the pandemic accelerating a widening bifurcation between sector winners and losers, real estate strategies constructed around resilient structural drivers are serving an even more essential role in investors’ portfolios. This has been a boon for the residential sector, as all things “living” have come to be seen as potential replacements for declining allocations to retail and office amidst ongoing uncertainty.
Given this appetite for residential strategies, the case for essential housing is as compelling as ever. Despite early concerns that the Class B apartment segment would falter given the perception that many renters-by-necessity were employed in vulnerable industries and more sensitive to changes in their financial positions, fundamentals have held up remarkably well. Collections have tracked closely with those of higher-income oriented Class A properties, and vacancy remains tight.
Yet while housing that caters to renters making 80-120% of Area Median Income (AMI) is in high demand across the country given the segment’s supply-demand imbalance, some markets may have a greater confluence of critical attributes than others. The analysis that follows is meant to serve as an add-on to our research on the essential housing opportunity and provide a market selection framework lens through which investors can evaluate essential market-rate housing strategies.

Anatomy of Class B Renter Cohort
To identify where the opportunities in essential housing are most compelling, we need to understand which markets’ demand may be the most resilient and fundamentals most conducive to achieving critical required return thresholds. This necessitates compiling an adequate profile of our target renter. And while trying to band households into tidy groupings is an exercise in painting broad strokes, these commonalities can provide a sufficient basis from which to begin evaluating markets.
So who are Class B renters? These renters…
- …are increasingly educated. According to the most recent American Community Survey conducted by the U.S. Census Bureau, a whopping 57% of moderately burdened renter households nationally (roughly 5.6 million of them) have attended at least some post-secondary education.
- …span the gamut of industries and occupations. Class B renters work in all types of industries, serving in occupations like administrative and office support to construction to healthcare – the diversity is impressive, as the single largest employment category comprises just 13% of the Class B renter base nationally!
- …are getting older. There is an equal number of moderately burdened households above the age of 45 as there is of those between the ages of 25-44.
- …are parents. Nearly one-third of all moderately burdened households have children.
“a whopping 57% of moderately burdened renter households nationally (roughly 5.6 million of them) have attended at least some post-secondary education.”

Vital Signs: Essential Renter Demand by Market
Though demand for essential housing is ubiquitous, there is a need to balance socially conscientious rental practices with the economic goals of any essential housing program in order to preserve the longevity of the strategy and continue its work of doing well (for its investors) by doing good (for its renters). Thus, with our renter snapshot firmly in hand, we can begin to identify target markets where we have strong conviction that we can solve for affordability by preserving the accessibility of affordable housing while simultaneously achieving investors’ goals – we do this through checking what we call the market’s vital signs.
Pulse Check: Today’s Rents and Today’s Incomes
Area median income (AMI) is a calculation released annually by the U.S. Department of Housing and Urban Development (HUD) that seeks to represent the exact midpoint in metropolitan household incomes (whereby half of households’ incomes are above the AMI, and the other half below). When comparing AMI to effective chunk rents (the actual monthly check a renter cuts), the resulting rent-to-income (RTI) ratio becomes a critical metric for measuring household cost-burden thresholds. Similarly, monitoring annual AMI movements in metros provides meaningful insight into the market’s rent growth elasticity - increases in AMI can create room for gentle increases in rental rates that serve to offset routine increases in maintenance, real estate taxes and security expenses, all the while remaining below the median affordability threshold 30% rent-to-income level.
“This number is a critical one: 30% is the maximum percentage of household income that can be allocated to rent, above which a household is characterized as problematically cost burdened by HUD.”
Given that the aim of essential housing investing is to maintain housing affordability for the greatest share of qualifying households, market selection should consider today’s rents relative to where rents would need to be for households making 80-120% of AMI to be comfortably at or below 30% RTI. In Figure 1, we’ve taken the 2021 median income for a 1.5-person household (a HUD standard) and calculated the maximum monthly rent level at which those making 80%, 100% and 120% of AMI would be paying no more than 30%, then compared these values to current median market rents. Markets where current rents (denoted by the green circle) are above the upper end of the grey band (Riverside and Miami) are those where affordability is the most stretched for the greatest number of strategy-qualifying households, as not even making 120% of AMI allows someone to afford the rents without surpassing the 30% limit.
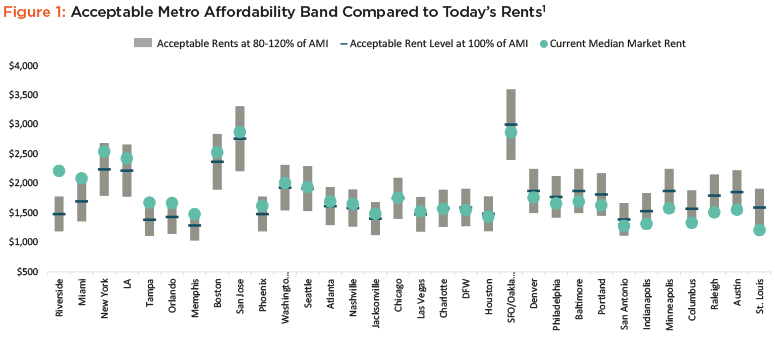
As we move from left to right, current rents begin to move within reach of those making between 100-120% of AMI in cities like New York, LA, and Boston, but also markets generally viewed as being more affordable, such as Tampa, Orlando, and Memphis.
Markets on the right-most side are those that approach an affordable level for those making 80% of AMI. Even still, only one market’s current rents are actually below the maximum affordable level for a household earning 80% of AMI; and this says nothing as to the availability of suitable housing at these given price points, only that it is feasible to afford if it can be found.
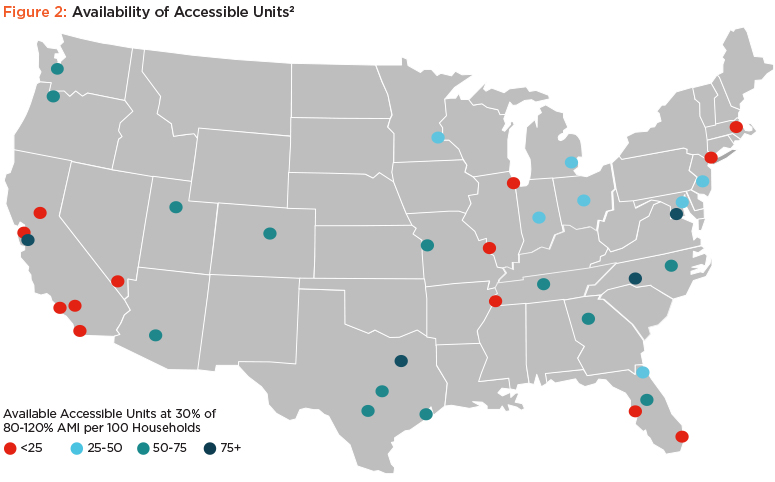
Availability is the other part of the puzzle in cities where current market rents appear to be attainable to most of our target renter cohort. To measure the availability of attainable housing within these acceptable rent bands, we adopted a similar methodology to that found in the ULI Terwilliger Center 2021 Home Attainability Index. We started by aggregating the number of existing market-rate apartments in each metro whose current average effective rent for any size unit fell between the 80%- 120% rent cap (that is, the monthly rent levels shown in Figure 1 that would not require more than 30% of household income going towards rent). We then considered the number of vacant units in this range compared to the number of moderately cost-burdened renter households in the metro. The resulting metric reflects a rough estimate of the number of financially accessible and vacant market-rate apartment units per 100 moderately burdened households.
Of the markets analyzed, just four had 75 or more available and accessible units per 100 households, though many had much, much fewer. In fact, across the universe of markets we considered, on average, there are just 43 available and accessible units per every 100 households in need of spaces in this rent range (Figure 2). And those markets nearer the right-hand side of Figure 1? In Raleigh and Austin, the number of available and affordable units is 52 and 59 per 100 households, respectively, suggesting there are nearly 2 households vying for every accessible vacant unit.

Temperature Check: Future Affordability Exacerbation
Though on the surface it would appear that many markets’ rents are accessible to at least some portion of households making between 80-120% of AMI, strategies should not just be focused on current need, but on future need. Markets where affordability is projected to worsen will need capital focused on preserving relative accessibility, creating a logical place for essential housing funds.
To quantify where this was likely to occur, we thought about what forces tend to erode affordability – while local regulations and NIMBYism indeed influence the availability of attainable housing (by virtue of making it more difficult to deliver new low-to moderate-income oriented stock), the commonality across markets that have seen affordability erode in recent years has been the impact of net movers to a metro. While households of all income levels move into and out of cities for a variety of reasons, the profile of certain metros’ in-migration suggests inflows have the effect of exacerbating affordability.
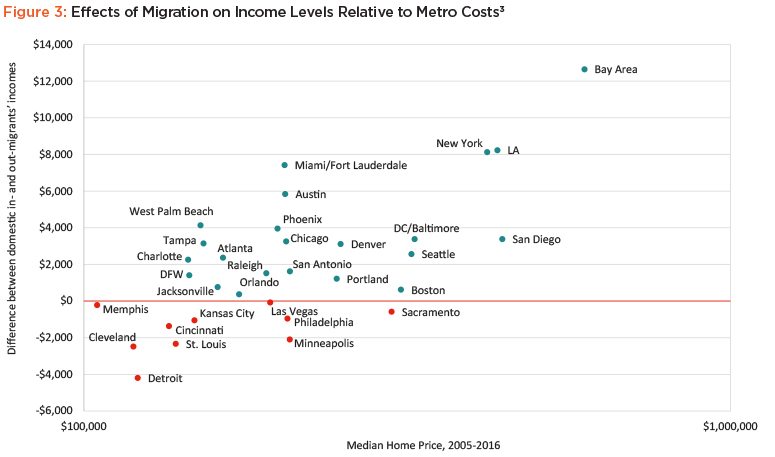
Leveraging off past work conducted by BuildZoom, Figure 3 demonstrates the difference between the median incomes of residents moving out of a city compared to those moving in relative to residential affordability. Markets above the line are those where the incomes of those moving in represented an increase relative to those leaving – absent high-cost metros such as San Francisco, New York and LA (where high starting prices necessitate higher incomes to entice would-be residents), we can see that the net effect of migration into lower-cost, high-growth metros has been a rise in resident incomes.
While on the surface this doesn’t sound like a bad thing, what this suggests to us is that metros that have historically been more affordable to Class B renters on a relative basis become increasingly less so as in-migration continues. Why?
Simply put, the arrival of higher earners does not suddenly eliminate middle-income earners who choose to stay; rather, it skews median metro incomes higher, moving what is considered the affordable rent band for 80-120% of AMI upward, without a reciprocal increase in existing renters’ incomes, creating a “left behind” effect.
In this environment, landlords and developers alike will often opt to pursue this more affluent cohort via renovation of existing properties and delivery of new construction in lieu of preserving existing Class B stock, with the corresponding result of driving metro-wide rents higher.
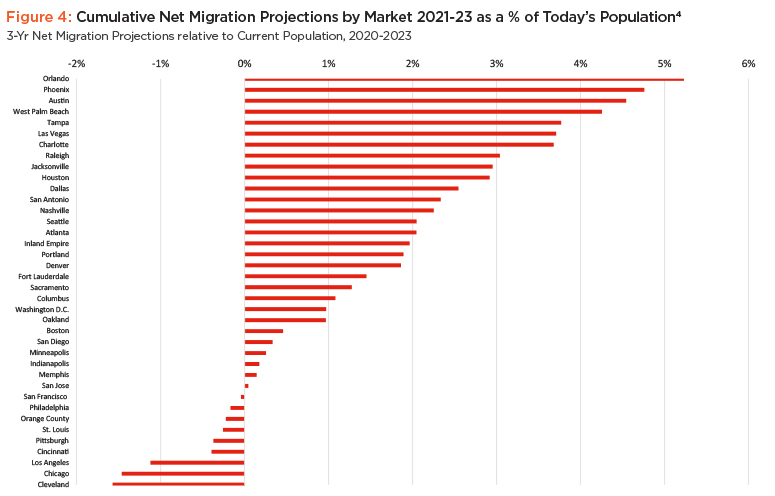
With this in mind, we can identify those markets where cumulative net migration over the next three years is more likely to create these upward pressures (Figure 4). Markets with high in-migration projections, such as Orlando (5.23%) and Austin (4.54%) stand out in this regard as large projected population inflows are expected to drive rental rate appreciation, further reducing the availability of attainably priced housing for many households. As a result, we anticipate high-growth markets will greatly benefit from an essential housing strategy that aims to protect Class B renters from the downstream effects of population inflows by preserving the supply of essential housing from excess rent appreciation.

Respiration Rate: Breathing Room Through Potential for Job Prosperity
Looking more granularly at the economic health of the Class B renter cohort, we wanted to frame up the impact of the pandemic on, and the future growth prospects for occupations commonly held by moderately cost-burdened households in order to identify markets with a propensity to lessen rentership loads via greater Class B renter prosperity. While it is indisputable that the pandemic spurred financial hardship for many households, these aches were not universally felt, with much of the pain concentrated in the lowest class of wage earners.
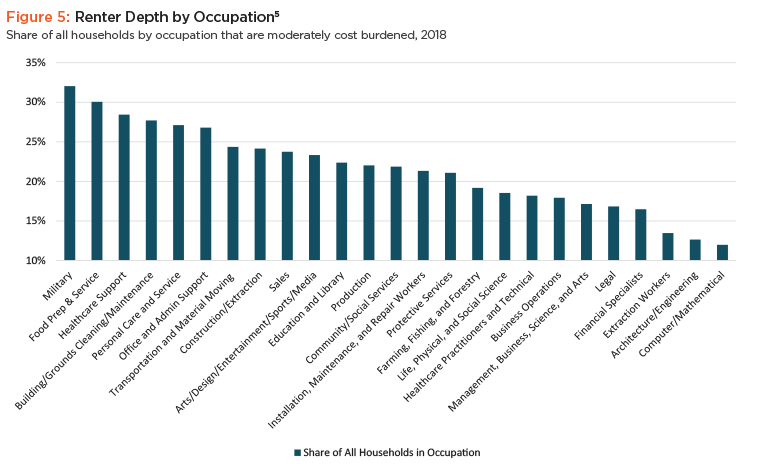
A common refrain we hear is that moderately cost-burdened households are rent stressed due to primarily being employed in low-wage jobs that are at perpetually higher risk of layoffs due to automation, obsolescence or in recent months, mandated shutdowns, all of which creates a perception that the segment may be riskier than other apartment strategies. And while it is true that householders in food prep and service are more prone to being moderately cost burdened, there are plenty of white-collar professions (such as architects, engineers, teachers, healthcare practitioners and those in legal vocations) where the share of all households that are moderately cost burdened is above 10% (Figure 5).
Though nearly all employment sectors experienced pandemic-induced job losses at the national level, variations in market resiliency and growth prospects suggest that future opportunities for greater earning potential for our target renters vary meaningfully from market to market. By knowing the composition of moderately burdened household employment nationally, we can back into which markets these industries fared better (or worse) during the pandemic, and just as importantly, which markets are poised to have the strongest growth in these key industries on a go-forward basis. This allows us to craft a strategy centered on markets where greater job prospects for our target renters could lessen rent burdens.
As we looked at employment fundamentals across our potential universe of metros, resilient outliers began to emerge, demonstrating the significance of market selection. For instance, Austin’s employment base fared far better throughout the pandemic than most other markets, with aggregate employment in all the Class B occupations shown in Figure 5 only declining by 10.8% from their pre-pandemic levels. Furthermore, by the end of Q2 2021 Austin is expected to have recovered 85.1% of pandemic-produced job losses and the metro’s Class B employment aggregate is expected to fully recover by the end of Q3 2021.
“Alongside market resiliency, future employment growth directly correlates to the propensity for higher earnings among Class B renters.”
Austin’s rapid recovery demonstrates its propensity for resilience and thus warrants the metro’s inclusion in essential housing strategies. Conversely, COVID-19 had a greater impact on the Fort Lauderdale employment base, which saw 13.7% of Class B jobs lost during the pandemic; what’s more, the metro’s recovery thus far has been more lackluster, with only 57.3% of pandemic job losses recovered. Projections indicate a prolonged recovery for Fort Lauderdale’s employment market, which is not expected to fully recover until the second quarter of 2023. Given the depth of the contraction and subsequent momentum for recovery, Fort Lauderdale’s healing as it relates to Class B employment prospects will take eight quarters longer that the Austin market (Fig 6).
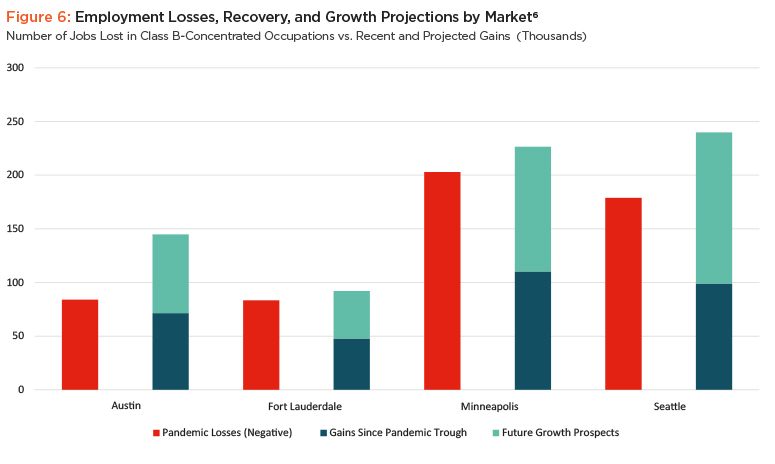
Alongside market resiliency, future employment growth directly correlates to the propensity for higher earnings among Class B renters. For example, despite Seattle’s pandemic decline of 12.5% in Class B occupations relative to their 2019 levels, the metro is expected to not only regain its lost jobs but expand beyond pre-pandemic levels by a robust 4.2% by the end of 2025. As a point of comparison, the Minneapolis employment market experienced a similar pandemic-induced contraction and subsequent recovery rate to date (roughly half the jobs lost), though projections for the metro do not indicate as promising of growth opportunities for Class B renters as are expected in Seattle. By year-end 2025, employment in Class B-heavy occupations in Minneapolis are expected to be just 1.6% above their pre-COVID levels (significantly below Seattle’s 4.2% increase). As a result, successful essential housing strategies would likely be more successful foregoing Minneapolis, where less-compelling employment opportunities for renters mean weakened economic prospects, and instead opting to focus on markets with greater runway like Seattle.

Any Side Effects? A One-Time Booster Shot to Class B Renter Incomes
Recent headlines have reported on severe labor shortages in heavily pandemic-disrupted industries. However, the issue of decreased labor force participation is more complex than the simplified shortage theory implies. Rather than a permanent worker shortage, we envision more of a transitory supply and demand imbalance as employees have been reluctant to return to the workforce for a combination of reasons, of which the culmination is greater than any one individual contribution. The accumulation of pandemic-inspired early retirements, lingering virus concerns, inadequate and inconsistent childcare options, and increased supplemental unemployment benefits have fostered an employment environment where there are more job openings than available employees.
Though fears of the labor shortage’s permanence surround the approximately 2.5 million pandemic-inspired retirees (more than double 2019 levels), the long-term impact is expected to reduce the labor force participation rate by only 40 basis points. Furthermore, with 70% of the adult population projected to be vaccinated by the fall, we anticipate a gradual decline in virus fears, allowing more immunocompromised employees to safely return to the labor force. Likewise, schools and childcare facilities are expected to return to full capacity for the coming school year, allowing parents (especially mothers) to make a more forceful return to the workforce. With 26 states terminating enhanced unemployment benefits ahead of the September 6th expiration date, approximately 4 million workers will be re-entering the workforce, easing supply constraints across the nation. Thus, we have conviction that labor mismatches will begin to recede in the fall and resolve themselves in the following six to twelve months.
However, despite company frustrations, the temporary worker shortage provides a breath of opportunity for Class B renters looking to re-enter the workforce or change employers. As businesses struggle to fulfill their staffing needs, employers have begun competing for talent by raising wages and offering signing bonuses. These attraction methods have become increasingly commonplace in the leisure and hospitality sectors, which is extremely beneficial for Class B renters employed in these fields. With the near-term labor frenzy enticing employees with higher wages, workers are securing jobs at higher base rates. This one-time salary boost subsequently becomes a permanent rate for these early re-entry workers (as these employees will not suddenly receive a pay cut when supply constraints subside). This rare opportunity to capitalize on the supply-demand imbalance will allow capable households to upscale their incomes – coupled with organic job growth beyond the current frenzy, Class B renter health appears poised to improve even further.
Conclusion
Though the economic maladies resulting from the pandemic are likely to persist in some form for a while, workers’ earning potential appears poised to increase as the recovery continues to gain steam. And because the current mismatch between labor supply and employer demand seems most acute in roles frequently occupied by Class B renters, the income-related feed-through boost for moderately burdened households is expected to be particularly pronounced, making today an even more compelling time to consider an investment in essential market-rate housing.
With investors demonstrating their commitment to social betterment, new strategies seeking to capture this capital are likely to enter the fray at a quickening pace in the years ahead. Investors will need to consider what is promised relative to what can be delivered, and by what mechanisms returns are slated to be achieved.
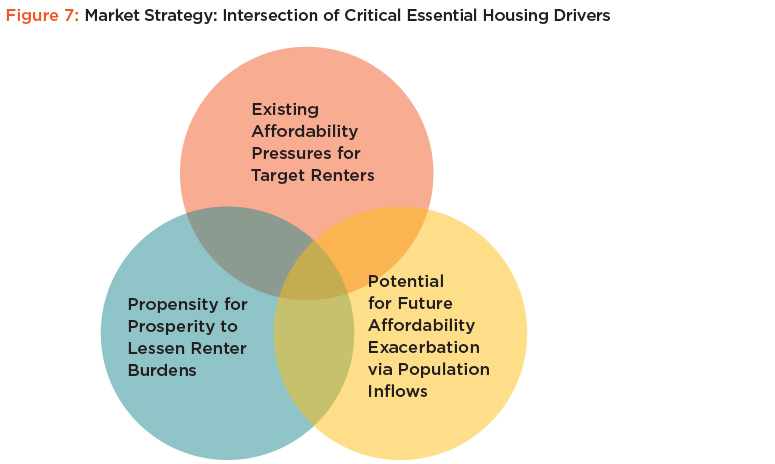
A winning essential housing strategy is one that first and foremost services a growing need from an oft-overlooked renter class. In our view, the markets that are best positioned to deliver on this mandate for investors are those that demonstrate a combination of
- A. Existing affordability pressures for some or all of the 80-120% of AMI target renter class;
- B. Material expectations for continued net migration inflows such that preserving Class B housing for existing renters is critical; and
- C. Stronger job prospects in key Class B renter occupations to provide greater financial security and lessen renter burdens.
1Acceptable rent ranges reflect the monthly rent a household could pay at a 30% rent-to-income ratio. Ranges are calculated using the Area Median Income (AMI) data information published by the U.S. Department of Housing and Urban Development using HUD guidelines of 1.5 persons at 80%, 100% and 120% of AMI. Markets sorted from left to right based on whether households at 80, 100 or 120% of AMI could afford current rents without surpassing the 30% threshold and by how much above the 80% level current rents are. Source: American Realty Advisors based on data from on the U.S. Department of Housing and Urban Development, Office of Policy Development and Research and Zillow as of July 2021. 2Metric demonstrates extent to which market-rate rental housing is attainable and available to households whereby rent does not exceed 30% rent-to-income for those making between 80-120% of AMI. Inputs include number of moderately burdened renter households and the number of qualifying vacant market-rate units. Higher number indicates the metro has a greater proportion of housing stock attainable to essential renters. Source: American Realty Advisors based on data from the ULI Terwilliger Center 2021 Home Attainability Index, JCHS tabulations of the 2018 American Community Survey 1-Year Estimates, ESRI and CoStar as of July 2021. 3Source: American Realty Advisors based on data from BuildZoom, U.S. Census (ACS), and Zillow. 4Source: American Realty Advisors based on data from Oxford Economics as of June 2021. 52018 is the latest year data is available. Source: American Realty Advisors based on data from JCHS tabulations of U.S. Census Bureau data and the 2018 American Community Survey 1-Year Estimates. 6Source: American Realty Advisors based on data from Oxford Economics, 2021.
Full disclousure information can be found by downloading the PDF above.